Big fall in the number of passengers
The first count of passenger after the national and international COVID-19 travel-bans showed a fall of 12.7 pct. in the number of passengers on scheduled flights from the six international airports. This accounted to an increase of 1,621 passengers compared to the same period last year. This was mainly driven by the introduction of the travel-ban in the month of March, which saw 2,166 fewer passengers compared to the year before.
Table 1. Number of passengers on scheduled flights in 1st quarter, 2018-2020
|
|
2018 |
2019 |
2020 |
|
Kangerlussuaq .................. |
12,044 |
11,384 |
10,136 |
|
Nuuk .......................... |
843 |
802 |
544 |
|
Kulusuk ....................... |
351 |
262 |
209 |
|
Ilulissat ....................... |
231 |
163 |
90 |
|
Nerlerit inaat ................... |
134 |
126 |
137 |
|
Narsarsuaq .................... |
112 |
0 |
0 |
|
Total .......................... |
13,715 |
12,737 |
11,116 |
Table on Statbank: bank.stat.gl/tueupax
Source: Greenland Airports.
Passengers on chartered and scheduled flights
Due to a technical glitch in Kangerlussuaq, there have been a large part of the passengers in January and February whom are of unknown origin.
In the 1st quarter of 2020, a total of 11,200 passengers departed from the six international airports on scheduled and chartered flights, compared to the same period last year, this was a decrease of 1,671 passengers.
Figure 1. Number of passengers on chartered and scheduled flights in the 1st quarter, 2018-2020
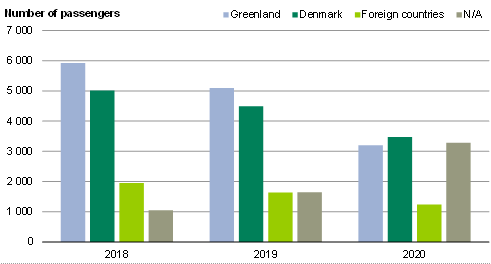
Table on Statbank: bank.stat.gl/tuefly
Source: Greenland Airports.
Table 2. Number of passengers on chartered and scheduled flights in the 1st quarter, 2018-2020
|
2018 |
2019 |
2020 |
|
|
Greenland ................... |
5,920 |
5,095 |
3,200 |
|
Denmark .................... |
5,018 |
4,448 |
3,474 |
|
Foreign countries ............. |
1,956 |
1,637 |
1,242 |
|
N/A ......................... |
1,047 |
1,651 |
3,284 |
|
Total ....................... |
13,941 |
12,871 |
11,200 |
Table on Statbank: bank.stat.gl/tuefly
Source: Greenland Airports.
Among the passengers under “Foreign countries”, the figure below shows the distribution by country of residence.
Figure 2. Share of foreign passengers distributed by country of residence in the 1st quarter, 2019-2020
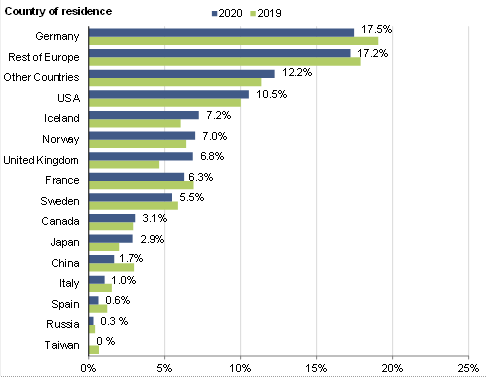
Table on Statbank: bank.stat.gl/tuefly
Source: Greenland Airports.